Read the article: A Guide for Healthcare Data Interoperability | Astera Blog
What it is
“A Guide for Healthcare Data Interoperability” is a long-form blog article by the Astera Marketing Team, first published in 2023 and updated in September 2025. It explains why interoperability matters, the standards behind it (HL7 and FHIR), the main challenges, and ways to achieve it, with four infographics placed alongside the text
How it teaches interoperability
The article teaches through written explanation supported by visual summaries. It opens with real cases where a lack of interoperability harmed patients, including a 2008 death in Utah and a 2011 settlement paid by the U.S. Department of Veterans Affairs, which show why the concept matters. It then defines interoperability, introduces HL7 and FHIR, and moves through challenges, stakeholders, and solutions. Each major section is paired with an infographic that condenses its main points. This presents interoperability as a connected system of people, standards, and obstacles, not a single technical fix, which supports the integrative understanding that makes it a threshold concept.
Critique using Mayer’s principles
Signaling and segmenting. Clear headings and subheadings divide the article into sections, and the infographics use numbered cards or a step-by-step path to show structure. Readers also control their own pace as they scroll.
Pre-training. Before discussing challenges, the article defines interoperability using the HIMSS definition and explains HL7 and FHIR in plain terms. Learning the key terms first prepares the reader for the harder material that follows.
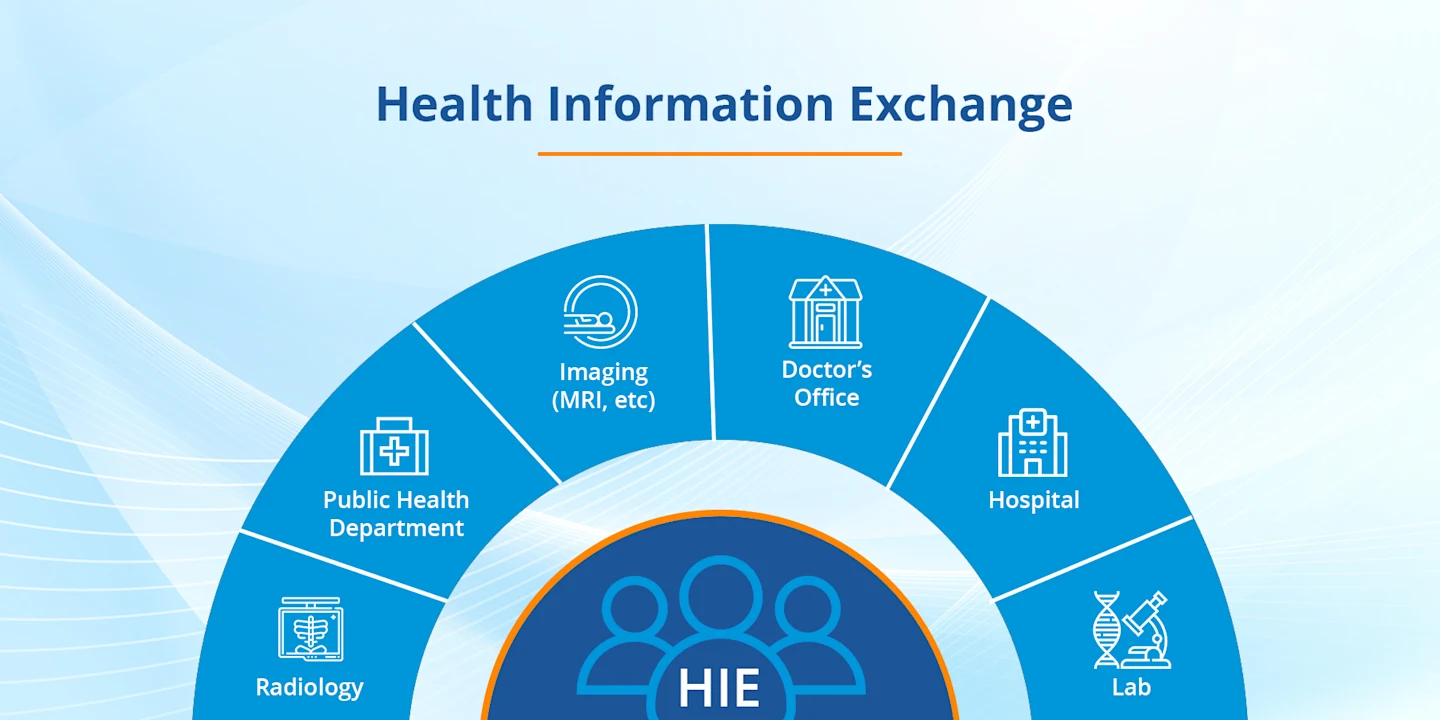
Multimedia and spatial contiguity. In the Health Information Exchange graphic below, each label sits inside its segment beside its icon, around a central hub. Words and picture appear together, so the structure is clear at a glance, which supports the multimedia principle.
Source: Astera Blog
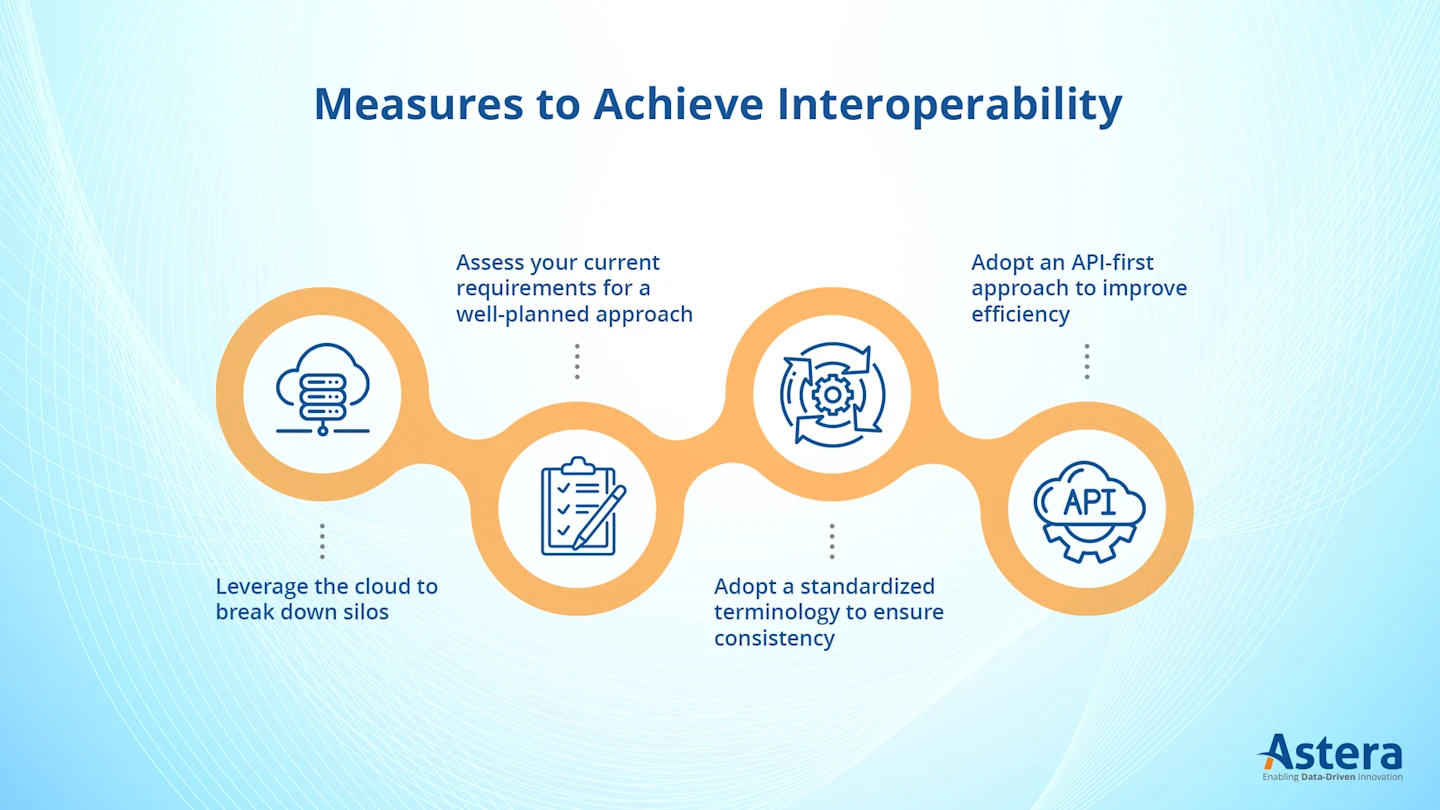
In the “Measures” graphic below, icons such as a cloud and a clipboard reinforce each step, though the labels float above and below the circles on dotted lines, slightly separating them from their icons.
Source: Astera Blog
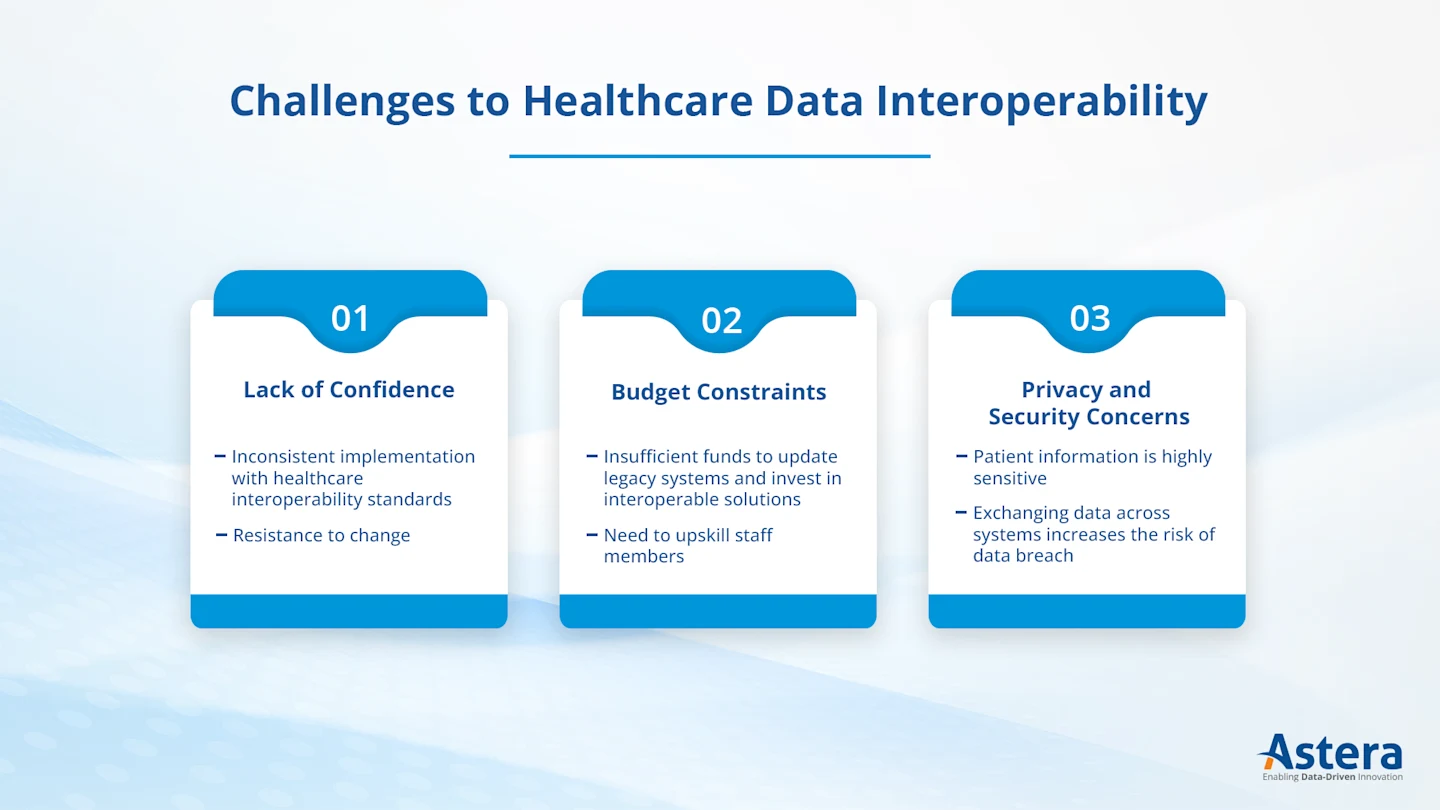
Redundancy and coherence. The challenges graphic below also calls the first challenge “Lack of Confidence,” while the article calls it “Lack of Coordination,” an inconsistency that could confuse a learner. Decorative backgrounds add minor clutter.
Source: Astera Blog
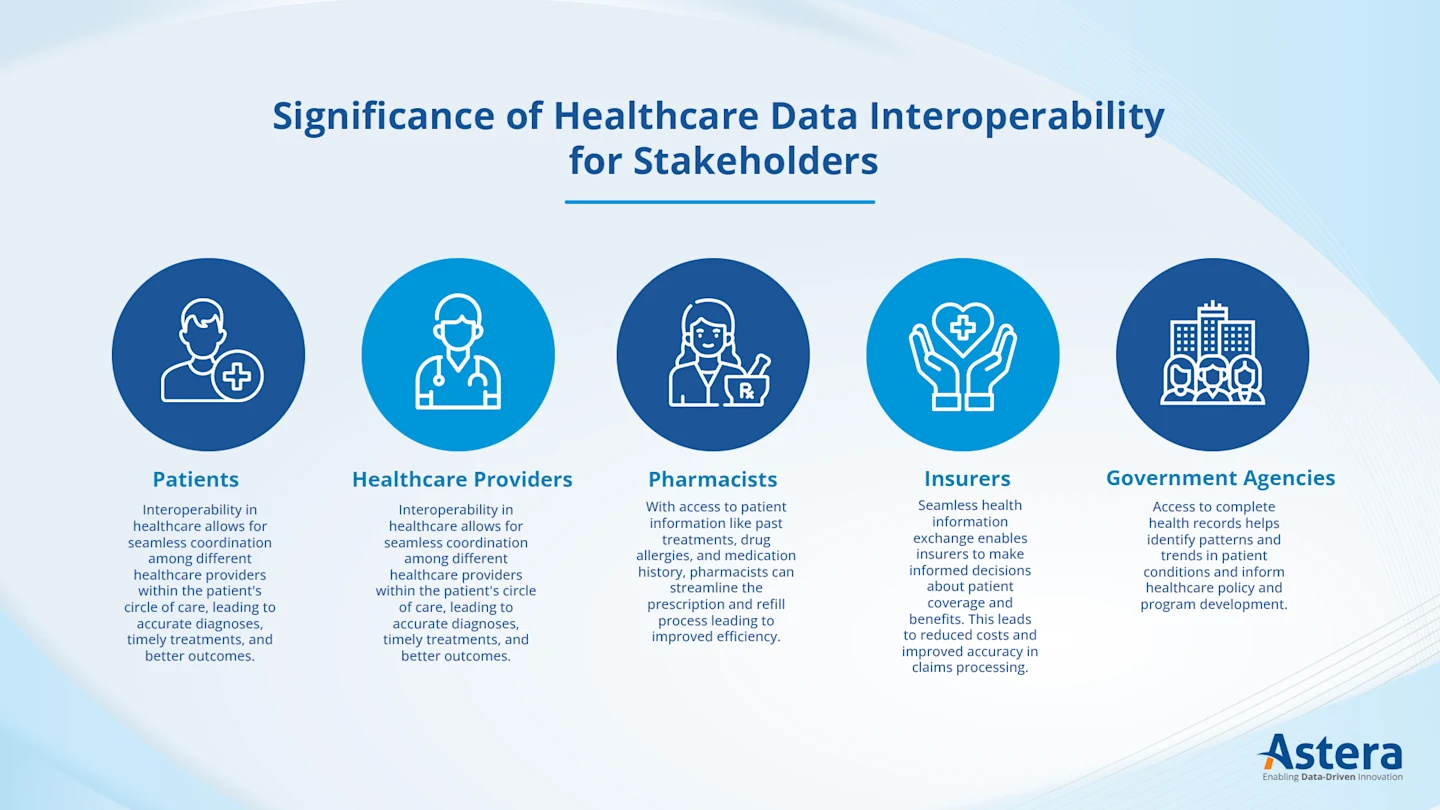
The stakeholder graphic below repeats the article’s wording almost word for word, and it uses the same sentence for patients and for healthcare providers. This duplicates text without adding meaning, and the small print is hard to read.
Source: Astera Blog
My Experience
There is a lot of text to scan through, which I found tiring to get through in full. However, the infographics helped explain the text better by giving me a quick visual summary of each section, so the text and graphics worked best together. Compared to the YouTube video in review 1, this blog allows me to read at my own pace despite the extra effort it took to scan and process all of its information.
Verdict
Useful as a broad overview for beginners. I would shorten the text and keep the graphics consistent with it.